Menu
- Home
- About Us
- Political
- Culture
-
Education
-
Admission 2024 of Nalanda University is now open

- ICCR Scholarship for Academic Year 2024-2025
- Extension of last date of application submission on SPDC Portal for the Academic Year 2023-24
-
Overseas Student Doctoral Program at BITS Pilani Academic Year 2024-2025
-
Upcoming ITEC Training Courses for the FY 2023-2024
-
Announcement of AYUSH Scholarship Scheme for the Academic Year 2023-2024
-
ICCR Scholarship for Cambodian students for Academic for Year 2023-2024
- India-Cambodia Educational Relations
- Indian Scholarship Schemes for Cambodian Students
- Capacity Building through ITEC Program
- Indian Technical & Economic Cooperation Programme (ITEC)
-
ASEAN PhD Fellowship
-
Admission 2024 of Nalanda University is now open
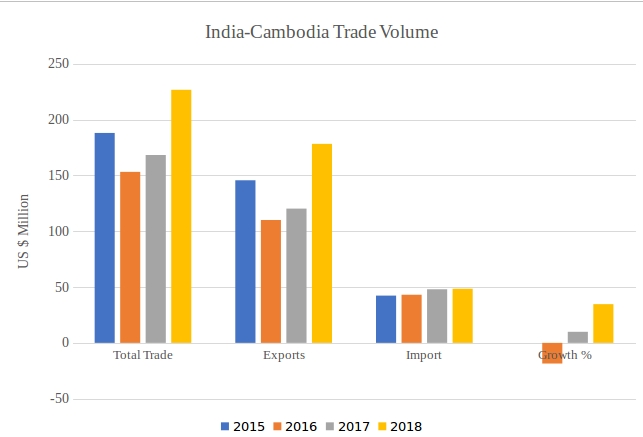
- Commercial
-
Consular
- Consular
- Advisory
- Visa
- Passport
- Overseas Citizenship of India
- Open House
- Frequently Asked Questions
- Emergency Contact
- Online Birth Registration
-
Restoration of Electronic Visa (e-visa)
- Government Programmes for Migrant Workers
-
Important Information for PIO Cardholders in Cambodia
-
Relaxation on Visa & Travel restrictions for Foreign Tourists
- Indian Diaspora
- Right To Information
- Development Partnerships